A zoomable, pannable, Leaflet map awaits. Just follow the image link above (Milecastle 39, since you ask) or read on to find out more about the processing involved and what the colour scales you see actually indicate. The leaflet map loads with a straightforward OpenStreetMap background and an overlay of the areas designated as Scheduled Monuments (basically the whole thing, but also highlighting a lot of associated features). Lidar layers can be selected from the menu, with opacity controls below.
I have for some time been a devotee of the Relief Visualization Toolbox developed by the Research Centre of the Slovenian Academy of Sciences and Arts. However, it has always been the case that no single visualisation will suffice alone (cf Bennett et al. 2012) and I have generally found that some combination of multi-directional hill shading and a non-directional technique (local relief, sky-view-factor, openness) makes for the best results. I have my own preferences (as we will see below) but things move on and following on from the continuing work of Kokalj and Somrak 2019, RVT2.2 now has built in capability for producing blended visualisations. I may have to experiment further (at first sight I still prefer the flexibility of adjusting individual layer blending within QGIS)...
Notwithstanding the above, there has long been a purist strain that says if it's there, it will be visible in a hill-shaded image. True up to a point. If it has no surface expression, there's nothing there for the lidar to show, but there are ways of making things show better.
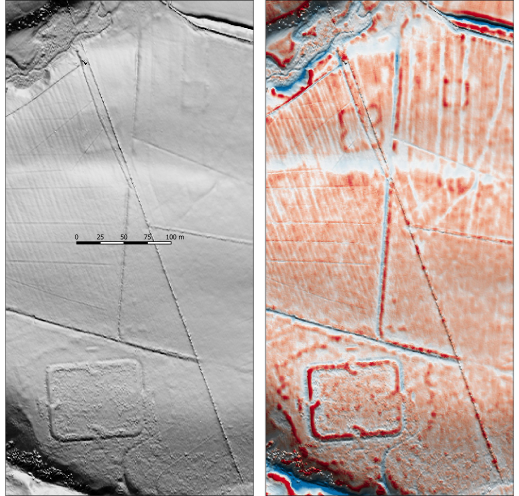
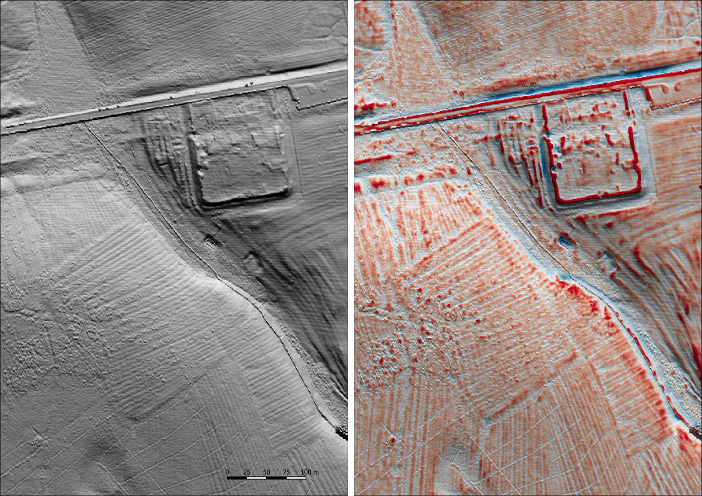
Two different layers are available on the Leaflet map. One is indeed a simple multi-directional hill-shade digital terrain model (DTM), expressed here as a greyscale (ok, I know that doesn't sound simple). It suffers from the usual problems of deep shadows and areas of saturation when applied to areas of high relief (hard to avoid without using a much higher sun elevation, which just ends up making the things you want to see less visible). The DTM is a bare-earth model, filtered to remove vegetation cover (a good thing) and walls and buildings (not a good thing when the things filtered out include Hadrian's Wall itself).
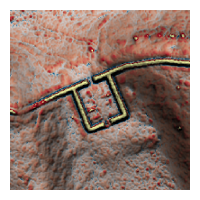
The second layer is based on the Digital Surface Model (DSM) dataset (including Hadrian's Wall therefore!). Multi-directional hillshading of the DSM is here merged with a positive openness (Doneus 2013) plot of the DTM. The colour ramp applies red shading to the highest openness values and blue shading to the lowest, picking out walls and banks (red) and ditches and hollows (white and blue). Two things should be noted. Firstly, openness applies equally to the natural topography so that sharp changes of slope may be picked out as strongly as artificial features (comparison to the DTM greyscale is therefore always useful when it comes to interpretation). Secondly, the choice of blue for the lowest values means that watercourses are often pleasingly depicted, but doesn't mean that every blue-shaded area holds (or necessarily could hold) water.
This is (currently) my preferred approach to visualisation. I find it combines a clarity of expression with a pleasing aesthetic quality (but that may just be me). The above plot of Carrawburgh (Brocolita), I hope helps make the point. The camp to the south-west has only recently been identified on lidar imagery (I should have got this done sooner!). Apparently just 'traces of a possible Roman camp'. I would say more than just 'possible' on the basis of the above. To go further, it is worth comparing the straightforward DTM plots in Collins 2015 (below) with the visualisations here, but I leave this as an exercise to the reader and you can decide whether you agree.
References
Bennett, R., Welham, K., Hill, R.A. and Ford, A. 2012 'A Comparison of Visualization Techniques for Models Created from Airborne Laser Scanned Data', Archaeol. Prospect. 19, 41–48.
Collins, R. 2015 Hadrian's Wall and LiDAR. New features in an ancient frontier landscape, FREDHI Report 1, Newcastle University pdf
Doneus, M. 2013 'Openness as Visualization Technique for Interpretative Mapping of Airborne Lidar Derived Digital Terrain Models', Remote Sensing 5(12), 6427-6442
Historic England 2018 Using Airborne Lidar in Archaeological Survey: The Light Fantastic, Swindon
Kokalj, Ž. and Somrak, M. 2019 'Why Not a Single Image? Combining Visualizations to Facilitate Fieldwork and On-Screen Mapping', Remote Sensing 11(7), 747.